
In the battle against global plastic pollution, PLA (polylactic acid), PBAT (polybutylene adipate/terephthalate), and corn starch, as the three pillars of biodegradable materials, have been game changers in packaging and agriculture.
PLA: From Medical Wizard to Environmental Pioneer
1930-1960: An Unexpected Discovery in the Laboratory
– 1954: DuPont obtained the first PLA synthesis patent (US2668162)
– PLA cost more than $1,000 per kilogram during this period, limited to high-end medical research
1970-1990: The Golden Age of Medicine
– 1966: U.S. Army Institute of Surgical Research develops PLA absorbable sutures.
– 1974: PLA bone nails were first successfully used for clinical fracture fixation
– 1987: Shimadzu Corporation in Japan built a pilot PLA production line
After 1997: A new era of environmentally friendly materials
– 1997: NatureWorks was founded, starting the first year of PLA industrialization.
– 2003: PLA prices fell below the $3/kg mark for the first time.
– 2023: global PLA production capacity exceeded 800,000 tons, accounting for more than 40% of China
Second, PBAT: the green reversal of petroleum-based materials
1920-1960: accumulation of basic science
– 1928: German chemists synthesized aromatic-aliphatic copolyester for the first time.
– 1950s: DuPont developed PBAT precursor technology for specialty fibers.
1990s: Environmental awareness leads to breakthroughs
– 1993: BASF launches the “Ecoflex” secret development program.
– 1998: First commercially available PBAT at a price of US$15/kg.
– 1999: PBAT is certified compostable by the European Union (EN13432).
The Rise of Chinese Power
– 2005: CAS breaks through the technical barrier of PBAT localization
– 2016: JDF built Asia’s largest PBAT production line
– 2022: China’s PBAT production capacity accounts for 75% of the world, and the price drops to $2/kg
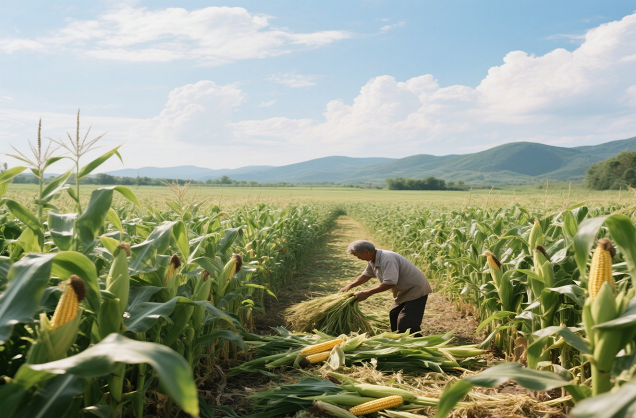
Third, corn starch: the oldest modern solution
19th century: the dawn of industrial application
– 1840: Britain granted the first starch modification patent
– 1890s: starch started to be used in paper and textile sizing
The awakening of environmental awareness
– 1973: The oil crisis leads to a boom in starch-based plastics research
– 1985: Novamont, Italy, launches first starch-based shopping bag
– 1990: Starch-based plastics are produced in 10,000 tons for the first time.
A New Era of Technology Integration
– 2008: Starch/PLA composites break through the strength bottleneck
– 2015: Film with 30% starch content reaches PE mechanical properties
– 2023: the global starch-based plastics market size of 3.5 billion U.S. dollars
Four, five milestones that changed the world
1.1997 PLA industrialization:
NatureWorks was founded
Production capacity: 14,000 tons/year
Price reduced from $1000/kg to $5/kg.
2.2005 China’s technological breakthrough:
Chinese Academy of Sciences developed new PBAT process
Reduced production cost by 40
Promote the outbreak of Asian market
3.2015 Modified Starch Revolution:
Starch compatibilizer technology matured
Starch content increased to 50%
Significant improvement in product transparency
4.2020 Global Plastic Ban Wave:
67 countries implement plastic restrictions
Demand for biodegradable materials grows by 300
China’s “Toughest Plastic Restriction” in force
5. 2023 Circular economy takes shape:
PLA/PBAT/starch ternary system is mature.
Degradation time can be controlled in 3-12 months.
Cost gap with PE narrowed to 20

Future Prospects of Materials Science
Technological frontier breakthrough:
– Fourth-generation PLA: Corbion launches new varieties with heat resistance of 120°C in 2022
– Intelligent PBAT: BASF releases photo-biological dual degradation formula in 2023
– Nanostarch: MIT develops nanostarch composites with 5-fold increased strength by 2021
Market Growth Forecast:
– Global Degradable Plastics Market Size:
2023: $8.2 billion
2025 (forecast): $12 billion
2030 (forecast): $28 billion
– Regional Distribution:
Asia: 58% market share
Europe: 23 percent
North America: 15 percent

Summarize your business so the visitor can learn about your offerings from any page on your website.